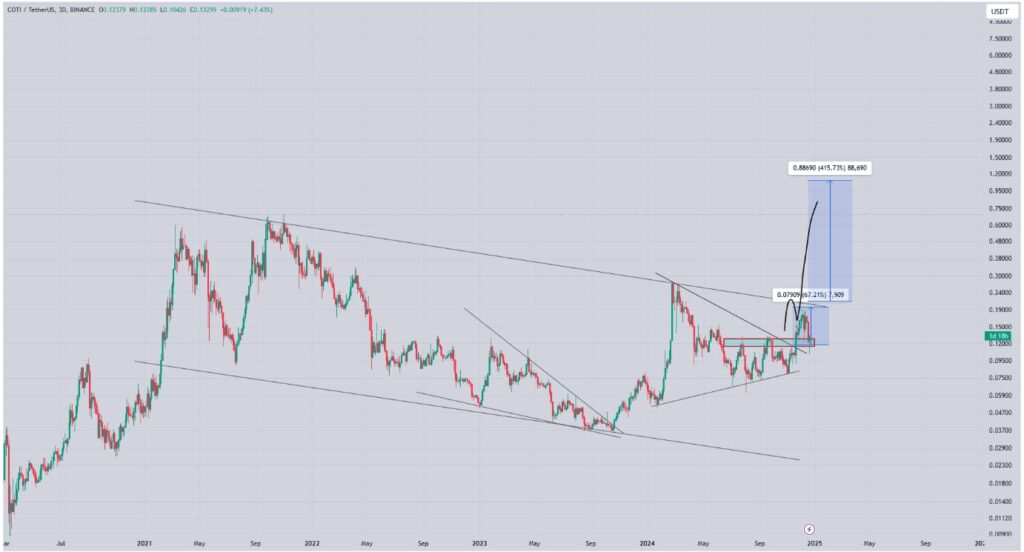
COTI/USDT Technical Analysis:

Graphic Analysis
The chart shows that a long-term downtrend has broken out. The price has broken out of a downward wedge formation. It is also seen that the price has found a strong buyer at the support level after the breakout.
Support and Resistance Levels
Supports:
- 0.1200 USDT – A key horizontal support and previous resistance zone.
- 0.0900 USDT – The lower boundary of the long-term downtrend.
Resistors: - 0.1900 USDT – Previous horizontal resistance level.
- 0.3000 USDT – One of the historical resistance levels.
- 0.8869 USDT – Medium term target level.
Targets and Prices
The target price indicated in the chart is:
- Medium Term Target: 0.3000 USDT (approximately 67% increase).
- Long-Term Target: 0.8869 USDT (approximately 415% increase).
Indicators
- Volume: Volume is increasing with the breakout. This shows that buyers are stepping in.
- RSI: Moving into the overbought territory, but there is still upside potential.
- MA (Moving Averages): It is trading above the 50 and 200-day moving averages, which supports the uptrend.
Formations and Formation Reversal
- Wedge Formation: Resulted in an upward breakout that ended the downtrend.
- Potential Formation: Inverse head and shoulders formation may be observed.
Trend Direction
The trend is upward in the short and medium term. In the long term, a stronger rise can be expected with the breaking of resistance levels.
Strategy
- Purchase Strategy:
- Purchases can be made between 0.1200-0.1300 USDT.
- Buying opportunities can be evaluated in pullbacks after the breakout.
- Stop Loss:
- Positions can be closed at closing levels below 0.0900 USDT.
- Taking Profit:
- First target: 0.1900 USDT.
- Second target: 0.3000 USDT.
- Long-term target: 0.8869 USDT.
Comment
There is a clear trend reversal signal on the COTI/USDT chart. Considering the formation break and the positive direction of the indicators, upward movements are expected to continue in the short and medium term. However, holding above the 0.1200 USDT level is critical. Depending on the strength of the trend, the probability of reaching the target levels seems high.